


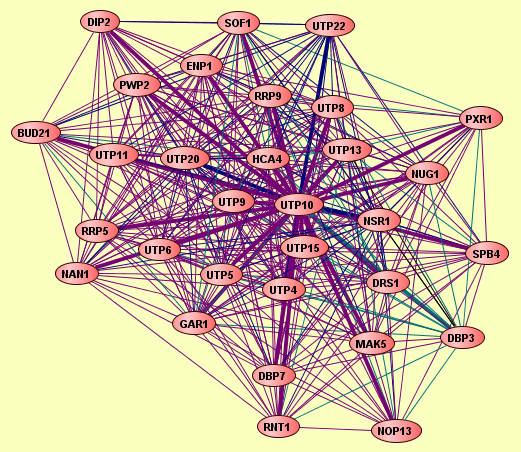
| Protein: | UTP10 |
| From Publication: | Qiu J, Noble WS (2008) Predicting Co-Complexed Protein Pairs from Heterogeneous Data. PLoS Comput Biol 4(4): e1000054. doi:10.1371/journal.pcbi.1000054 |
| Complexes containing UTP10: | 42 |
| LEGEND: |
|||
| = Same process, or one is unknown. | = Same branch, distance 4. | ||
| = Same branch, distance 1. | = Same branch, distance 5. | ||
| = Same branch, distance 2. | = Same branch, distance 6 or more. | ||
| = Same branch, distance 3. | = Not in same branch of GO. | ||
| Size | Notes | Members | |
| View GO Analysis | 2 proteins | Classfier did not use Gene Ontology annotations. [FDR: 0.021] [SVM Score: 0.939291243381] | DRS1 UTP10 |
| View GO Analysis | 2 proteins | Classfier did not use Gene Ontology annotations. [FDR: 0.021] [SVM Score: 0.938108695605] | NSR1 UTP10 |
| View GO Analysis | 2 proteins | Classfier did not use Gene Ontology annotations. [FDR: 0.021] [SVM Score: 0.927703680159] | UTP10 UTP5 |
| View GO Analysis | 2 proteins | Classfier did not use Gene Ontology annotations. [FDR: 0.021] [SVM Score: 0.920804622845] | UTP10 UTP6 |
| View GO Analysis | 2 proteins | Classfier did not use Gene Ontology annotations. [FDR: 0.021] [SVM Score: 0.899700076742] | GAR1 UTP10 |
| View GO Analysis | 2 proteins | Classfier did not use Gene Ontology annotations. [FDR: 0.021] [SVM Score: 0.845069998047] | UTP10 UTP4 |
| View GO Analysis | 2 proteins | Classfier did not use Gene Ontology annotations. [FDR: 0.021] [SVM Score: 0.821624242582] | UTP10 UTP9 |
| View GO Analysis | 2 proteins | Classfier did not use Gene Ontology annotations. [FDR: 0.021] [SVM Score: 0.788501316728] | UTP10 UTP8 |
| View GO Analysis | 2 proteins | Classfier did not use Gene Ontology annotations. [FDR: 0.091] [SVM Score: 0.774236679277] | UTP10 UTP13 |
| View GO Analysis | 2 proteins | Classfier did not use Gene Ontology annotations. [FDR: 0.021] [SVM Score: 0.629580097667] | UTP10 UTP15 |
| View GO Analysis | 2 proteins | Classfier did not use Gene Ontology annotations. [FDR: 0.021] [SVM Score: 0.606658473125] | NAN1 UTP10 |
| View GO Analysis | 2 proteins | Classfier did not use Gene Ontology annotations. [FDR: 0.04] [SVM Score: 0.535808102279] | PXR1 UTP10 |
| View GO Analysis | 2 proteins | Classfier did not use Gene Ontology annotations. [FDR: 0.021] [SVM Score: 0.51534205512] | NUG1 UTP10 |
| View GO Analysis | 2 proteins | Classfier did not use Gene Ontology annotations. [FDR: 0.021] [SVM Score: 0.507874375934] | DBP7 UTP10 |
| View GO Analysis | 2 proteins | Classfier did not use Gene Ontology annotations. [FDR: 0.021] [SVM Score: 0.455408390718] | NOP13 UTP10 |
| View GO Analysis | 2 proteins | Classfier did not use Gene Ontology annotations. [FDR: 0.021] [SVM Score: 0.451747521834] | MAK5 UTP10 |
| View GO Analysis | 2 proteins | Classfier did not use Gene Ontology annotations. [FDR: 0.04] [SVM Score: 0.424545995203] | HCA4 UTP10 |
| View GO Analysis | 2 proteins | Classfier did not use Gene Ontology annotations. [FDR: 0.021] [SVM Score: 0.407670775617] | DBP3 UTP10 |
| View GO Analysis | 2 proteins | Classfier did not use Gene Ontology annotations. [FDR: 0.057] [SVM Score: 0.322791189439] | SPB4 UTP10 |
| View GO Analysis | 2 proteins | Classfier did not use Gene Ontology annotations. [FDR: 0.091] [SVM Score: 0.291183643079] | ENP1 UTP10 |
| View GO Analysis | 2 proteins | Classifier used Gene Ontology annotations. [FDR: 0.02] [SVM Score: 1.34488854998] | UTP10 UTP5 |
| View GO Analysis | 2 proteins | Classifier used Gene Ontology annotations. [FDR: 0.02] [SVM Score: 1.25819563546] | UTP10 UTP15 |
| View GO Analysis | 2 proteins | Classifier used Gene Ontology annotations. [FDR: 0.02] [SVM Score: 1.20277117958] | NAN1 UTP10 |
| View GO Analysis | 2 proteins | Classifier used Gene Ontology annotations. [FDR: 0.02] [SVM Score: 1.187097075] | UTP10 UTP9 |
| View GO Analysis | 2 proteins | Classifier used Gene Ontology annotations. [FDR: 0.02] [SVM Score: 1.03767020221] | UTP10 UTP6 |
| View GO Analysis | 2 proteins | Classifier used Gene Ontology annotations. [FDR: 0.02] [SVM Score: 0.960961532906] | UTP10 UTP11 |
| View GO Analysis | 2 proteins | Classifier used Gene Ontology annotations. [FDR: 0.02] [SVM Score: 0.958266978613] | BUD21 UTP10 |
| View GO Analysis | 2 proteins | Classifier used Gene Ontology annotations. [FDR: 0.02] [SVM Score: 0.957259537703] | GAR1 UTP10 |
| View GO Analysis | 2 proteins | Classifier used Gene Ontology annotations. [FDR: 0.02] [SVM Score: 0.95483057487] | UTP10 UTP4 |
| View GO Analysis | 2 proteins | Classifier used Gene Ontology annotations. [FDR: 0.02] [SVM Score: 0.916903805013] | PWP2 UTP10 |
| View GO Analysis | 2 proteins | Classifier used Gene Ontology annotations. [FDR: 0.02] [SVM Score: 0.909162386641] | UTP10 UTP13 |
| View GO Analysis | 2 proteins | Classifier used Gene Ontology annotations. [FDR: 0.069] [SVM Score: 0.902800663064] | NSR1 UTP10 |
| View GO Analysis | 2 proteins | Classifier used Gene Ontology annotations. [FDR: 0.038] [SVM Score: 0.882645812914] | UTP10 UTP8 |
| View GO Analysis | 2 proteins | Classifier used Gene Ontology annotations. [FDR: 0.02] [SVM Score: 0.864079017295] | DRS1 UTP10 |
| View GO Analysis | 2 proteins | Classifier used Gene Ontology annotations. [FDR: 0.02] [SVM Score: 0.82730473796] | DIP2 UTP10 |
| View GO Analysis | 2 proteins | Classifier used Gene Ontology annotations. [FDR: 0.083] [SVM Score: 0.790181679332] | RNT1 UTP10 |
| View GO Analysis | 2 proteins | Classifier used Gene Ontology annotations. [FDR: 0.038] [SVM Score: 0.74627219101] | UTP10 UTP20 |
| View GO Analysis | 2 proteins | Classifier used Gene Ontology annotations. [FDR: 0.038] [SVM Score: 0.706074183122] | ENP1 UTP10 |
| View GO Analysis | 2 proteins | Classifier used Gene Ontology annotations. [FDR: 0.054] [SVM Score: 0.668809719483] | SOF1 UTP10 |
| View GO Analysis | 2 proteins | Classifier used Gene Ontology annotations. [FDR: 0.054] [SVM Score: 0.660088217359] | RRP9 UTP10 |
| View GO Analysis | 2 proteins | Classifier used Gene Ontology annotations. [FDR: 0.099] [SVM Score: 0.537874838029] | UTP10 UTP22 |
| View GO Analysis | 2 proteins | Classifier used Gene Ontology annotations. [FDR: 0.07] [SVM Score: 0.522790012625] | RRP5 UTP10 |