| |
Size |
Notes |
Members |
| View GO Analysis |
2 proteins |
Classfier did not use Gene Ontology annotations. [FDR: 0.038] [SVM Score: 0.735157271164] |
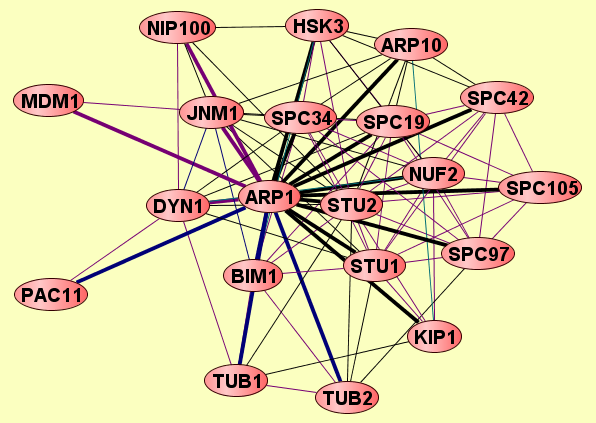
ARP1
SPC19
|
| View GO Analysis |
2 proteins |
Classifier used Gene Ontology annotations. [FDR: 0.02] [SVM Score: 1.86776064924] |
ARP1
JNM1
|
| View GO Analysis |
2 proteins |
Classifier used Gene Ontology annotations. [FDR: 0.02] [SVM Score: 1.01144594295] |
ARP1
STU1
|
| View GO Analysis |
2 proteins |
Classifier used Gene Ontology annotations. [FDR: 0.02] [SVM Score: 0.963570539842] |
ARP1
SPC19
|
| View GO Analysis |
2 proteins |
Classifier used Gene Ontology annotations. [FDR: 0.02] [SVM Score: 0.905800947629] |
ARP1
NUF2
|
| View GO Analysis |
2 proteins |
Classifier used Gene Ontology annotations. [FDR: 0.02] [SVM Score: 0.882351815008] |
ARP1
NIP100
|
| View GO Analysis |
2 proteins |
Classifier used Gene Ontology annotations. [FDR: 0.02] [SVM Score: 0.847894568188] |
ARP1
STU2
|
| View GO Analysis |
2 proteins |
Classifier used Gene Ontology annotations. [FDR: 0.036] [SVM Score: 0.8223800905] |
ARP1
SPC34
|
| View GO Analysis |
2 proteins |
Classifier used Gene Ontology annotations. [FDR: 0.083] [SVM Score: 0.791494101778] |
ARP1
DYN1
|
| View GO Analysis |
2 proteins |
Classifier used Gene Ontology annotations. [FDR: 0.054] [SVM Score: 0.702800663899] |
ARP1
TUB2
|
| View GO Analysis |
2 proteins |
Classifier used Gene Ontology annotations. [FDR: 0.069] [SVM Score: 0.696974697409] |
ARP1
BIM1
|
| View GO Analysis |
2 proteins |
Classifier used Gene Ontology annotations. [FDR: 0.036] [SVM Score: 0.696138973522] |
ARP1
KIP1
|
| View GO Analysis |
2 proteins |
Classifier used Gene Ontology annotations. [FDR: 0.054] [SVM Score: 0.662789428461] |
ARP1
HSK3
|
| View GO Analysis |
2 proteins |
Classifier used Gene Ontology annotations. [FDR: 0.038] [SVM Score: 0.6531729703] |
ARP1
ARP10
|
| View GO Analysis |
2 proteins |
Classifier used Gene Ontology annotations. [FDR: 0.069] [SVM Score: 0.642689725289] |
ARP1
TUB1
|
| View GO Analysis |
2 proteins |
Classifier used Gene Ontology annotations. [FDR: 0.069] [SVM Score: 0.602098056693] |
ARP1
SPC42
|
| View GO Analysis |
2 proteins |
Classifier used Gene Ontology annotations. [FDR: 0.069] [SVM Score: 0.600696036709] |
ARP1
MDM1
|
| View GO Analysis |
2 proteins |
Classifier used Gene Ontology annotations. [FDR: 0.069] [SVM Score: 0.527210884676] |
ARP1
SPC105
|
| View GO Analysis |
2 proteins |
Classifier used Gene Ontology annotations. [FDR: 0.099] [SVM Score: 0.46885087504] |
ARP1
PAC11
|
| View GO Analysis |
2 proteins |
Classifier used Gene Ontology annotations. [FDR: 0.07] [SVM Score: 0.446174055418] |
ARP1
SPC97
|