


| Protein: | ENT5 |
| From Publication: | Qiu J, Noble WS (2008) Predicting Co-Complexed Protein Pairs from Heterogeneous Data. PLoS Comput Biol 4(4): e1000054. doi:10.1371/journal.pcbi.1000054 |
| Complexes containing ENT5: | 8 |
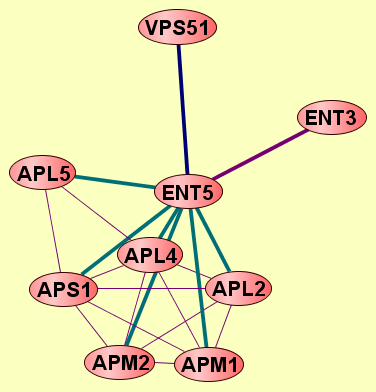
| LEGEND: |
|||
| = Same process, or one is unknown. | = Same branch, distance 4. | ||
| = Same branch, distance 1. | = Same branch, distance 5. | ||
| = Same branch, distance 2. | = Same branch, distance 6 or more. | ||
| = Same branch, distance 3. | = Not in same branch of GO. | ||
| Size | Notes | Members | |
| View GO Analysis | 2 proteins | Classifier used Gene Ontology annotations. [FDR: 0.02] [SVM Score: 1.14358233112] | APL2 ENT5 |
| View GO Analysis | 2 proteins | Classifier used Gene Ontology annotations. [FDR: 0.02] [SVM Score: 1.00141791668] | APM1 ENT5 |
| View GO Analysis | 2 proteins | Classifier used Gene Ontology annotations. [FDR: 0.02] [SVM Score: 0.946470194336] | APL4 ENT5 |
| View GO Analysis | 2 proteins | Classifier used Gene Ontology annotations. [FDR: 0.02] [SVM Score: 0.885481651622] | ENT3 ENT5 |
| View GO Analysis | 2 proteins | Classifier used Gene Ontology annotations. [FDR: 0.02] [SVM Score: 0.86154856325] | APS1 ENT5 |
| View GO Analysis | 2 proteins | Classifier used Gene Ontology annotations. [FDR: 0.02] [SVM Score: 0.689866981797] | ENT5 VPS51 |
| View GO Analysis | 2 proteins | Classifier used Gene Ontology annotations. [FDR: 0.069] [SVM Score: 0.589265962206] | APL5 ENT5 |
| View GO Analysis | 2 proteins | Classifier used Gene Ontology annotations. [FDR: 0.069] [SVM Score: 0.586552904483] | APM2 ENT5 |