


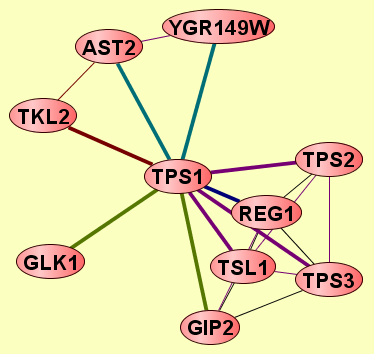
| Protein: | TPS1 |
| From Publication: | Qiu J, Noble WS (2008) Predicting Co-Complexed Protein Pairs from Heterogeneous Data. PLoS Comput Biol 4(4): e1000054. doi:10.1371/journal.pcbi.1000054 |
| Complexes containing TPS1: | 9 |
| LEGEND: |
|||
| = Same process, or one is unknown. | = Same branch, distance 4. | ||
| = Same branch, distance 1. | = Same branch, distance 5. | ||
| = Same branch, distance 2. | = Same branch, distance 6 or more. | ||
| = Same branch, distance 3. | = Not in same branch of GO. | ||
| Size | Notes | Members | |
| View GO Analysis | 2 proteins | Classfier did not use Gene Ontology annotations. [FDR: 0.021] [SVM Score: 0.658574276957] | TPS1 YGR149W |
| View GO Analysis | 2 proteins | Classfier did not use Gene Ontology annotations. [FDR: 0.021] [SVM Score: 0.567137942438] | GLK1 TPS1 |
| View GO Analysis | 2 proteins | Classfier did not use Gene Ontology annotations. [FDR: 0.057] [SVM Score: 0.404692353688] | AST2 TPS1 |
| View GO Analysis | 2 proteins | Classfier did not use Gene Ontology annotations. [FDR: 0.091] [SVM Score: 0.286190670318] | TKL2 TPS1 |
| View GO Analysis | 2 proteins | Classifier used Gene Ontology annotations. [FDR: 0.02] [SVM Score: 2.02447922112] | TPS1 TPS3 |
| View GO Analysis | 2 proteins | Classifier used Gene Ontology annotations. [FDR: 0.02] [SVM Score: 1.76010123338] | TPS1 TSL1 |
| View GO Analysis | 2 proteins | Classifier used Gene Ontology annotations. [FDR: 0.02] [SVM Score: 1.66689886119] | TPS1 TPS2 |
| View GO Analysis | 2 proteins | Classifier used Gene Ontology annotations. [FDR: 0.02] [SVM Score: 0.767708017841] | GIP2 TPS1 |
| View GO Analysis | 2 proteins | Classifier used Gene Ontology annotations. [FDR: 0.054] [SVM Score: 0.620902987294] | REG1 TPS1 |