| |
Size |
Notes |
Members |
| View GO Analysis |
2 proteins |
Classifier used Gene Ontology annotations. [FDR: 0.02] [SVM Score: 0.885481651622] |
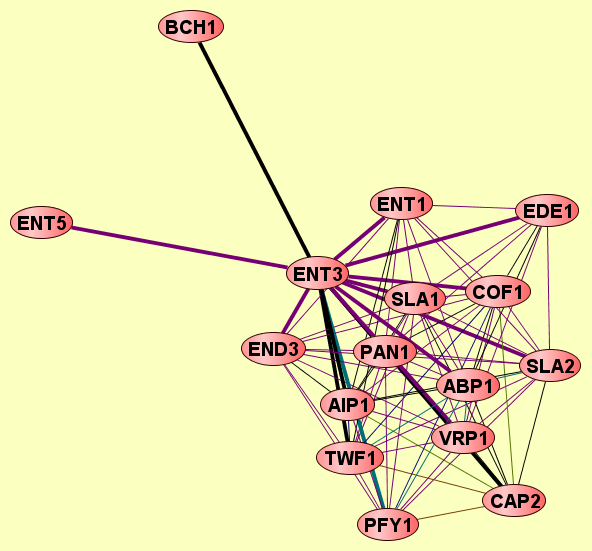
ENT3
ENT5
|
| View GO Analysis |
2 proteins |
Classifier used Gene Ontology annotations. [FDR: 0.02] [SVM Score: 0.859354577362] |
ENT1
ENT3
|
| View GO Analysis |
2 proteins |
Classifier used Gene Ontology annotations. [FDR: 0.02] [SVM Score: 0.813678622958] |
ENT3
PAN1
|
| View GO Analysis |
2 proteins |
Classifier used Gene Ontology annotations. [FDR: 0.02] [SVM Score: 0.758414870019] |
ENT3
SLA1
|
| View GO Analysis |
2 proteins |
Classifier used Gene Ontology annotations. [FDR: 0.02] [SVM Score: 0.728701993834] |
ABP1
ENT3
|
| View GO Analysis |
2 proteins |
Classifier used Gene Ontology annotations. [FDR: 0.02] [SVM Score: 0.708454474534] |
ENT3
SLA2
|
| View GO Analysis |
2 proteins |
Classifier used Gene Ontology annotations. [FDR: 0.054] [SVM Score: 0.596472529317] |
ENT3
PFY1
|
| View GO Analysis |
2 proteins |
Classifier used Gene Ontology annotations. [FDR: 0.069] [SVM Score: 0.58450534388] |
ENT3
VRP1
|
| View GO Analysis |
2 proteins |
Classifier used Gene Ontology annotations. [FDR: 0.069] [SVM Score: 0.543162161666] |
EDE1
ENT3
|
| View GO Analysis |
2 proteins |
Classifier used Gene Ontology annotations. [FDR: 0.069] [SVM Score: 0.530375734463] |
BCH1
ENT3
|
| View GO Analysis |
2 proteins |
Classifier used Gene Ontology annotations. [FDR: 0.054] [SVM Score: 0.526584550566] |
AIP1
ENT3
|
| View GO Analysis |
2 proteins |
Classifier used Gene Ontology annotations. [FDR: 0.084] [SVM Score: 0.513196510017] |
CAP2
ENT3
|
| View GO Analysis |
2 proteins |
Classifier used Gene Ontology annotations. [FDR: 0.069] [SVM Score: 0.502800165593] |
COF1
ENT3
|
| View GO Analysis |
2 proteins |
Classifier used Gene Ontology annotations. [FDR: 0.084] [SVM Score: 0.45491199372] |
ENT3
TWF1
|
| View GO Analysis |
2 proteins |
Classifier used Gene Ontology annotations. [FDR: 0.084] [SVM Score: 0.447278865796] |
END3
ENT3
|