


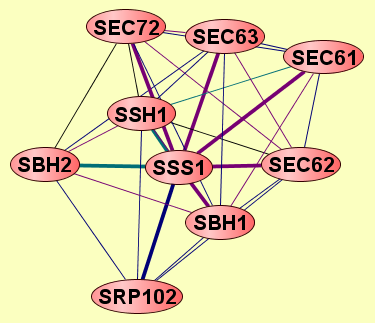
| Protein: | SSS1 |
| From Publication: | Qiu J, Noble WS (2008) Predicting Co-Complexed Protein Pairs from Heterogeneous Data. PLoS Comput Biol 4(4): e1000054. doi:10.1371/journal.pcbi.1000054 |
| Complexes containing SSS1: | 8 |
| LEGEND: |
|||
| = Same process, or one is unknown. | = Same branch, distance 4. | ||
| = Same branch, distance 1. | = Same branch, distance 5. | ||
| = Same branch, distance 2. | = Same branch, distance 6 or more. | ||
| = Same branch, distance 3. | = Not in same branch of GO. | ||
| Size | Notes | Members | |
| View GO Analysis | 2 proteins | Classifier used Gene Ontology annotations. [FDR: 0.02] [SVM Score: 1.93890059776] | SBH1 SSS1 |
| View GO Analysis | 2 proteins | Classifier used Gene Ontology annotations. [FDR: 0.02] [SVM Score: 1.00788169398] | SEC61 SSS1 |
| View GO Analysis | 2 proteins | Classifier used Gene Ontology annotations. [FDR: 0.02] [SVM Score: 0.926737937692] | SSH1 SSS1 |
| View GO Analysis | 2 proteins | Classifier used Gene Ontology annotations. [FDR: 0.02] [SVM Score: 0.823366281505] | SEC62 SSS1 |
| View GO Analysis | 2 proteins | Classifier used Gene Ontology annotations. [FDR: 0.02] [SVM Score: 0.721806361691] | SBH2 SSS1 |
| View GO Analysis | 2 proteins | Classifier used Gene Ontology annotations. [FDR: 0.02] [SVM Score: 0.69385500003] | SRP102 SSS1 |
| View GO Analysis | 2 proteins | Classifier used Gene Ontology annotations. [FDR: 0.054] [SVM Score: 0.620606475324] | SEC63 SSS1 |
| View GO Analysis | 2 proteins | Classifier used Gene Ontology annotations. [FDR: 0.084] [SVM Score: 0.507302274491] | SEC72 SSS1 |