| |
Size |
Notes |
Members |
| View GO Analysis |
2 proteins |
Classfier did not use Gene Ontology annotations. [FDR: 0.021] [SVM Score: 0.820275341316] |
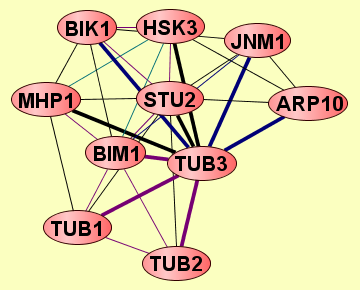
TUB1
TUB3
|
| View GO Analysis |
2 proteins |
Classfier did not use Gene Ontology annotations. [FDR: 0.074] [SVM Score: 0.77684616171] |
TUB2
TUB3
|
| View GO Analysis |
2 proteins |
Classfier did not use Gene Ontology annotations. [FDR: 0.021] [SVM Score: 0.563815741757] |
STU2
TUB3
|
| View GO Analysis |
2 proteins |
Classfier did not use Gene Ontology annotations. [FDR: 0.04] [SVM Score: 0.43367089423] |
BIK1
TUB3
|
| View GO Analysis |
2 proteins |
Classifier used Gene Ontology annotations. [FDR: 0.02] [SVM Score: 1.38989694867] |
TUB2
TUB3
|
| View GO Analysis |
2 proteins |
Classifier used Gene Ontology annotations. [FDR: 0.069] [SVM Score: 0.940124692904] |
TUB1
TUB3
|
| View GO Analysis |
2 proteins |
Classifier used Gene Ontology annotations. [FDR: 0.02] [SVM Score: 0.916621500636] |
MHP1
TUB3
|
| View GO Analysis |
2 proteins |
Classifier used Gene Ontology annotations. [FDR: 0.054] [SVM Score: 0.819793313461] |
BIM1
TUB3
|
| View GO Analysis |
2 proteins |
Classifier used Gene Ontology annotations. [FDR: 0.036] [SVM Score: 0.716748464555] |
STU2
TUB3
|
| View GO Analysis |
2 proteins |
Classifier used Gene Ontology annotations. [FDR: 0.069] [SVM Score: 0.706899483284] |
JNM1
TUB3
|
| View GO Analysis |
2 proteins |
Classifier used Gene Ontology annotations. [FDR: 0.054] [SVM Score: 0.64006208154] |
HSK3
TUB3
|
| View GO Analysis |
2 proteins |
Classifier used Gene Ontology annotations. [FDR: 0.069] [SVM Score: 0.552715338002] |
ARP10
TUB3
|
| View GO Analysis |
2 proteins |
Classifier used Gene Ontology annotations. [FDR: 0.069] [SVM Score: 0.47734939244] |
BIK1
TUB3
|