| |
Size |
Notes |
Members |
| View GO Analysis |
2 proteins |
Classfier did not use Gene Ontology annotations. [FDR: 0.021] [SVM Score: 0.657127243096] |
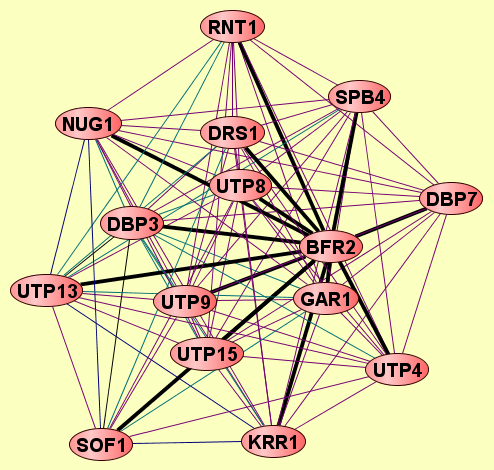
BFR2
UTP9
|
| View GO Analysis |
2 proteins |
Classfier did not use Gene Ontology annotations. [FDR: 0.021] [SVM Score: 0.638492603005] |
BFR2
UTP13
|
| View GO Analysis |
2 proteins |
Classfier did not use Gene Ontology annotations. [FDR: 0.021] [SVM Score: 0.601923894546] |
BFR2
SPB4
|
| View GO Analysis |
2 proteins |
Classfier did not use Gene Ontology annotations. [FDR: 0.021] [SVM Score: 0.553912259504] |
BFR2
GAR1
|
| View GO Analysis |
2 proteins |
Classfier did not use Gene Ontology annotations. [FDR: 0.021] [SVM Score: 0.52148241769] |
BFR2
UTP4
|
| View GO Analysis |
2 proteins |
Classfier did not use Gene Ontology annotations. [FDR: 0.057] [SVM Score: 0.433318538338] |
BFR2
DRS1
|
| View GO Analysis |
2 proteins |
Classfier did not use Gene Ontology annotations. [FDR: 0.057] [SVM Score: 0.41827097608] |
BFR2
DBP7
|
| View GO Analysis |
2 proteins |
Classfier did not use Gene Ontology annotations. [FDR: 0.057] [SVM Score: 0.408519856219] |
BFR2
KRR1
|
| View GO Analysis |
2 proteins |
Classfier did not use Gene Ontology annotations. [FDR: 0.057] [SVM Score: 0.389321733718] |
BFR2
UTP8
|
| View GO Analysis |
2 proteins |
Classfier did not use Gene Ontology annotations. [FDR: 0.073] [SVM Score: 0.346033537284] |
BFR2
NUG1
|
| View GO Analysis |
2 proteins |
Classfier did not use Gene Ontology annotations. [FDR: 0.073] [SVM Score: 0.330088098539] |
BFR2
SOF1
|
| View GO Analysis |
2 proteins |
Classfier did not use Gene Ontology annotations. [FDR: 0.073] [SVM Score: 0.31729070459] |
BFR2
RNT1
|
| View GO Analysis |
2 proteins |
Classfier did not use Gene Ontology annotations. [FDR: 0.074] [SVM Score: 0.309355044676] |
BFR2
UTP15
|
| View GO Analysis |
2 proteins |
Classfier did not use Gene Ontology annotations. [FDR: 0.089] [SVM Score: 0.306358135372] |
BFR2
DBP3
|