


| Protein: | NIP100 |
| From Publication: | Qiu J, Noble WS (2008) Predicting Co-Complexed Protein Pairs from Heterogeneous Data. PLoS Comput Biol 4(4): e1000054. doi:10.1371/journal.pcbi.1000054 |
| Complexes containing NIP100: | 8 |
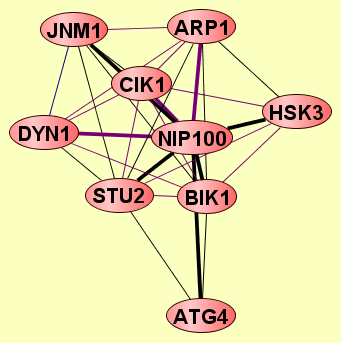
| LEGEND: |
|||
| = Same process, or one is unknown. | = Same branch, distance 4. | ||
| = Same branch, distance 1. | = Same branch, distance 5. | ||
| = Same branch, distance 2. | = Same branch, distance 6 or more. | ||
| = Same branch, distance 3. | = Not in same branch of GO. | ||
| Size | Notes | Members | |
| View GO Analysis | 2 proteins | Classifier used Gene Ontology annotations. [FDR: 0.02] [SVM Score: 1.16346959313] | JNM1 NIP100 |
| View GO Analysis | 2 proteins | Classifier used Gene Ontology annotations. [FDR: 0.02] [SVM Score: 1.08102854655] | HSK3 NIP100 |
| View GO Analysis | 2 proteins | Classifier used Gene Ontology annotations. [FDR: 0.02] [SVM Score: 0.882351815008] | ARP1 NIP100 |
| View GO Analysis | 2 proteins | Classifier used Gene Ontology annotations. [FDR: 0.037] [SVM Score: 0.634423532323] | DYN1 NIP100 |
| View GO Analysis | 2 proteins | Classifier used Gene Ontology annotations. [FDR: 0.069] [SVM Score: 0.610091216396] | BIK1 NIP100 |
| View GO Analysis | 2 proteins | Classifier used Gene Ontology annotations. [FDR: 0.037] [SVM Score: 0.607286126226] | ATG4 NIP100 |
| View GO Analysis | 2 proteins | Classifier used Gene Ontology annotations. [FDR: 0.037] [SVM Score: 0.593055750374] | NIP100 STU2 |
| View GO Analysis | 2 proteins | Classifier used Gene Ontology annotations. [FDR: 0.053] [SVM Score: 0.515303581141] | CIK1 NIP100 |