


| Protein: | NOG2 |
| From Publication: | Qiu J, Noble WS (2008) Predicting Co-Complexed Protein Pairs from Heterogeneous Data. PLoS Comput Biol 4(4): e1000054. doi:10.1371/journal.pcbi.1000054 |
| Complexes containing NOG2: | 9 |
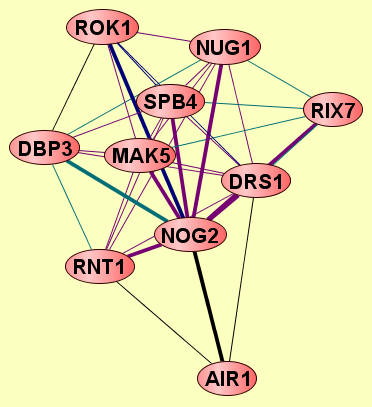
| LEGEND: |
|||
| = Same process, or one is unknown. | = Same branch, distance 4. | ||
| = Same branch, distance 1. | = Same branch, distance 5. | ||
| = Same branch, distance 2. | = Same branch, distance 6 or more. | ||
| = Same branch, distance 3. | = Not in same branch of GO. | ||
| Size | Notes | Members | |
| View GO Analysis | 2 proteins | Classifier used Gene Ontology annotations. [FDR: 0.02] [SVM Score: 0.829705902362] | NOG2 NUG1 |
| View GO Analysis | 2 proteins | Classifier used Gene Ontology annotations. [FDR: 0.054] [SVM Score: 0.646434364808] | DBP3 NOG2 |
| View GO Analysis | 2 proteins | Classifier used Gene Ontology annotations. [FDR: 0.054] [SVM Score: 0.625750920097] | MAK5 NOG2 |
| View GO Analysis | 2 proteins | Classifier used Gene Ontology annotations. [FDR: 0.069] [SVM Score: 0.602785091454] | DRS1 NOG2 |
| View GO Analysis | 2 proteins | Classifier used Gene Ontology annotations. [FDR: 0.069] [SVM Score: 0.536364182062] | NOG2 SPB4 |
| View GO Analysis | 2 proteins | Classifier used Gene Ontology annotations. [FDR: 0.069] [SVM Score: 0.526987833839] | AIR1 NOG2 |
| View GO Analysis | 2 proteins | Classifier used Gene Ontology annotations. [FDR: 0.069] [SVM Score: 0.515453140511] | NOG2 RIX7 |
| View GO Analysis | 2 proteins | Classifier used Gene Ontology annotations. [FDR: 0.069] [SVM Score: 0.508904424793] | NOG2 RNT1 |
| View GO Analysis | 2 proteins | Classifier used Gene Ontology annotations. [FDR: 0.099] [SVM Score: 0.488252177729] | NOG2 ROK1 |