| |
Size |
Notes |
Members |
| View GO Analysis |
2 proteins |
Classfier did not use Gene Ontology annotations. [FDR: 0.021] [SVM Score: 0.811681528748] |
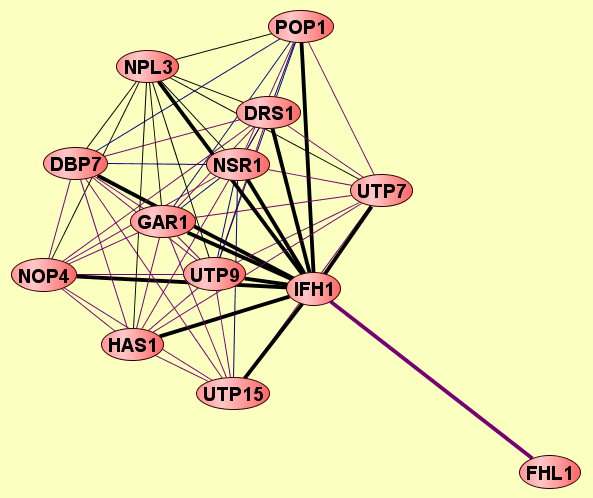
DRS1
IFH1
|
| View GO Analysis |
2 proteins |
Classfier did not use Gene Ontology annotations. [FDR: 0.021] [SVM Score: 0.807471160706] |
IFH1
POP1
|
| View GO Analysis |
2 proteins |
Classfier did not use Gene Ontology annotations. [FDR: 0.021] [SVM Score: 0.763747891779] |
IFH1
UTP7
|
| View GO Analysis |
2 proteins |
Classfier did not use Gene Ontology annotations. [FDR: 0.073] [SVM Score: 0.753660798367] |
IFH1
NPL3
|
| View GO Analysis |
2 proteins |
Classfier did not use Gene Ontology annotations. [FDR: 0.04] [SVM Score: 0.49881675538] |
DBP7
IFH1
|
| View GO Analysis |
2 proteins |
Classfier did not use Gene Ontology annotations. [FDR: 0.04] [SVM Score: 0.41319300308] |
IFH1
NOP4
|
| View GO Analysis |
2 proteins |
Classifier used Gene Ontology annotations. [FDR: 0.02] [SVM Score: 0.93851212202] |
IFH1
NSR1
|
| View GO Analysis |
2 proteins |
Classifier used Gene Ontology annotations. [FDR: 0.02] [SVM Score: 0.876877732057] |
IFH1
UTP7
|
| View GO Analysis |
2 proteins |
Classifier used Gene Ontology annotations. [FDR: 0.07] [SVM Score: 0.816209255554] |
GAR1
IFH1
|
| View GO Analysis |
2 proteins |
Classifier used Gene Ontology annotations. [FDR: 0.07] [SVM Score: 0.814993442424] |
IFH1
UTP9
|
| View GO Analysis |
2 proteins |
Classifier used Gene Ontology annotations. [FDR: 0.037] [SVM Score: 0.616804670337] |
IFH1
NOP4
|
| View GO Analysis |
2 proteins |
Classifier used Gene Ontology annotations. [FDR: 0.038] [SVM Score: 0.616500246506] |
IFH1
UTP15
|
| View GO Analysis |
2 proteins |
Classifier used Gene Ontology annotations. [FDR: 0.053] [SVM Score: 0.554053538385] |
FHL1
IFH1
|
| View GO Analysis |
2 proteins |
Classifier used Gene Ontology annotations. [FDR: 0.084] [SVM Score: 0.494986029893] |
HAS1
IFH1
|