


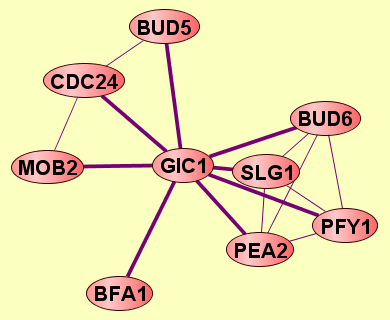
| Protein: | GIC1 |
| From Publication: | Qiu J, Noble WS (2008) Predicting Co-Complexed Protein Pairs from Heterogeneous Data. PLoS Comput Biol 4(4): e1000054. doi:10.1371/journal.pcbi.1000054 |
| Complexes containing GIC1: | 8 |
| LEGEND: |
|||
| = Same process, or one is unknown. | = Same branch, distance 4. | ||
| = Same branch, distance 1. | = Same branch, distance 5. | ||
| = Same branch, distance 2. | = Same branch, distance 6 or more. | ||
| = Same branch, distance 3. | = Not in same branch of GO. | ||
| Size | Notes | Members | |
| View GO Analysis | 2 proteins | Classifier used Gene Ontology annotations. [FDR: 0.02] [SVM Score: 0.938764702497] | GIC1 MOB2 |
| View GO Analysis | 2 proteins | Classifier used Gene Ontology annotations. [FDR: 0.02] [SVM Score: 0.798749582294] | CDC24 GIC1 |
| View GO Analysis | 2 proteins | Classifier used Gene Ontology annotations. [FDR: 0.038] [SVM Score: 0.695077020067] | GIC1 PEA2 |
| View GO Analysis | 2 proteins | Classifier used Gene Ontology annotations. [FDR: 0.038] [SVM Score: 0.692275365849] | GIC1 PFY1 |
| View GO Analysis | 2 proteins | Classifier used Gene Ontology annotations. [FDR: 0.054] [SVM Score: 0.679309856374] | BUD6 GIC1 |
| View GO Analysis | 2 proteins | Classifier used Gene Ontology annotations. [FDR: 0.069] [SVM Score: 0.540580951702] | BUD5 GIC1 |
| View GO Analysis | 2 proteins | Classifier used Gene Ontology annotations. [FDR: 0.084] [SVM Score: 0.495547979755] | BFA1 GIC1 |
| View GO Analysis | 2 proteins | Classifier used Gene Ontology annotations. [FDR: 0.069] [SVM Score: 0.464408361227] | GIC1 SLG1 |