| |
Size |
Notes |
Members |
| View GO Analysis |
2 proteins |
Classifier used Gene Ontology annotations. [FDR: 0.02] [SVM Score: 1.08067489208] |
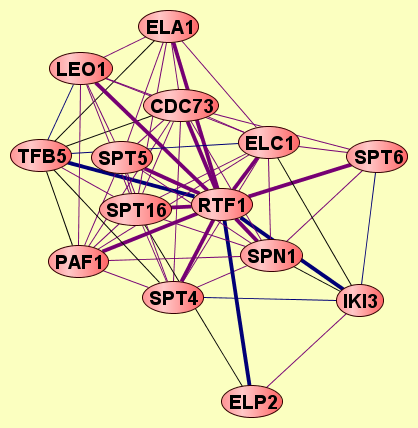
LEO1
RTF1
|
| View GO Analysis |
2 proteins |
Classifier used Gene Ontology annotations. [FDR: 0.02] [SVM Score: 1.05707955817] |
PAF1
RTF1
|
| View GO Analysis |
2 proteins |
Classifier used Gene Ontology annotations. [FDR: 0.02] [SVM Score: 0.996861195952] |
RTF1
SPT4
|
| View GO Analysis |
2 proteins |
Classifier used Gene Ontology annotations. [FDR: 0.02] [SVM Score: 0.918830060151] |
RTF1
SPN1
|
| View GO Analysis |
2 proteins |
Classifier used Gene Ontology annotations. [FDR: 0.02] [SVM Score: 0.878071126023] |
RTF1
SPT5
|
| View GO Analysis |
2 proteins |
Classifier used Gene Ontology annotations. [FDR: 0.02] [SVM Score: 0.835157710983] |
ELC1
RTF1
|
| View GO Analysis |
2 proteins |
Classifier used Gene Ontology annotations. [FDR: 0.038] [SVM Score: 0.70124339991] |
RTF1
TFB5
|
| View GO Analysis |
2 proteins |
Classifier used Gene Ontology annotations. [FDR: 0.054] [SVM Score: 0.619414328147] |
RTF1
SPT6
|
| View GO Analysis |
2 proteins |
Classifier used Gene Ontology annotations. [FDR: 0.054] [SVM Score: 0.605159082615] |
ELP2
RTF1
|
| View GO Analysis |
2 proteins |
Classifier used Gene Ontology annotations. [FDR: 0.038] [SVM Score: 0.566544207622] |
CDC73
RTF1
|
| View GO Analysis |
2 proteins |
Classifier used Gene Ontology annotations. [FDR: 0.069] [SVM Score: 0.538222096579] |
ELA1
RTF1
|
| View GO Analysis |
2 proteins |
Classifier used Gene Ontology annotations. [FDR: 0.069] [SVM Score: 0.521302342982] |
IKI3
RTF1
|
| View GO Analysis |
2 proteins |
Classifier used Gene Ontology annotations. [FDR: 0.069] [SVM Score: 0.486070566118] |
RTF1
SPT16
|