| |
Size |
Notes |
Members |
| View GO Analysis |
2 proteins |
Classfier did not use Gene Ontology annotations. [FDR: 0.021] [SVM Score: 0.989893057916] |
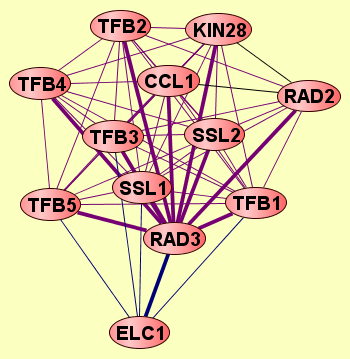
KIN28
RAD3
|
| View GO Analysis |
2 proteins |
Classfier did not use Gene Ontology annotations. [FDR: 0.021] [SVM Score: 0.794588354547] |
RAD3
TFB3
|
| View GO Analysis |
2 proteins |
Classfier did not use Gene Ontology annotations. [FDR: 0.038] [SVM Score: 0.736121810962] |
RAD3
TFB1
|
| View GO Analysis |
2 proteins |
Classifier used Gene Ontology annotations. [FDR: 0.02] [SVM Score: 2.01943921227] |
RAD3
TFB5
|
| View GO Analysis |
2 proteins |
Classifier used Gene Ontology annotations. [FDR: 0.02] [SVM Score: 1.28170843067] |
RAD3
SSL2
|
| View GO Analysis |
2 proteins |
Classifier used Gene Ontology annotations. [FDR: 0.02] [SVM Score: 0.986851583643] |
RAD3
TFB3
|
| View GO Analysis |
2 proteins |
Classifier used Gene Ontology annotations. [FDR: 0.02] [SVM Score: 0.975719029993] |
RAD3
SSL1
|
| View GO Analysis |
2 proteins |
Classifier used Gene Ontology annotations. [FDR: 0.02] [SVM Score: 0.97431010995] |
RAD3
TFB1
|
| View GO Analysis |
2 proteins |
Classifier used Gene Ontology annotations. [FDR: 0.02] [SVM Score: 0.955060073364] |
RAD2
RAD3
|
| View GO Analysis |
2 proteins |
Classifier used Gene Ontology annotations. [FDR: 0.02] [SVM Score: 0.935896211886] |
CCL1
RAD3
|
| View GO Analysis |
2 proteins |
Classifier used Gene Ontology annotations. [FDR: 0.02] [SVM Score: 0.892426558963] |
RAD3
TFB4
|
| View GO Analysis |
2 proteins |
Classifier used Gene Ontology annotations. [FDR: 0.02] [SVM Score: 0.843345623967] |
RAD3
TFB2
|
| View GO Analysis |
2 proteins |
Classifier used Gene Ontology annotations. [FDR: 0.036] [SVM Score: 0.832799197401] |
KIN28
RAD3
|
| View GO Analysis |
2 proteins |
Classifier used Gene Ontology annotations. [FDR: 0.069] [SVM Score: 0.522114425419] |
ELC1
RAD3
|