| |
Size |
Notes |
Members |
| View GO Analysis |
2 proteins |
Classifier used Gene Ontology annotations. [FDR: 0.02] [SVM Score: 1.24896393338] |
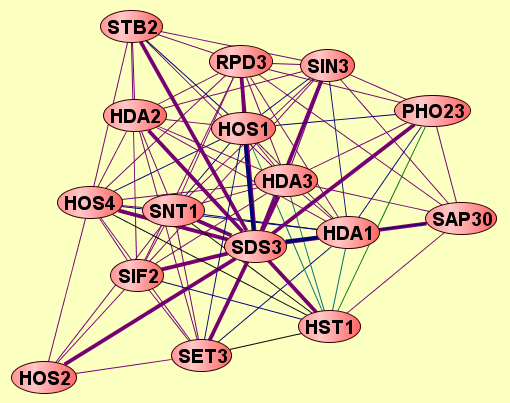
HOS4
SDS3
|
| View GO Analysis |
2 proteins |
Classifier used Gene Ontology annotations. [FDR: 0.02] [SVM Score: 1.12707711009] |
SDS3
SIN3
|
| View GO Analysis |
2 proteins |
Classifier used Gene Ontology annotations. [FDR: 0.02] [SVM Score: 0.894975810397] |
SDS3
SNT1
|
| View GO Analysis |
2 proteins |
Classifier used Gene Ontology annotations. [FDR: 0.02] [SVM Score: 0.874604512071] |
HDA3
SDS3
|
| View GO Analysis |
2 proteins |
Classifier used Gene Ontology annotations. [FDR: 0.02] [SVM Score: 0.863531111788] |
HDA2
SDS3
|
| View GO Analysis |
2 proteins |
Classifier used Gene Ontology annotations. [FDR: 0.02] [SVM Score: 0.798382827661] |
SDS3
SET3
|
| View GO Analysis |
2 proteins |
Classifier used Gene Ontology annotations. [FDR: 0.02] [SVM Score: 0.788314069434] |
SDS3
SIF2
|
| View GO Analysis |
2 proteins |
Classifier used Gene Ontology annotations. [FDR: 0.02] [SVM Score: 0.770145883229] |
PHO23
SDS3
|
| View GO Analysis |
2 proteins |
Classifier used Gene Ontology annotations. [FDR: 0.02] [SVM Score: 0.731168394211] |
HST1
SDS3
|
| View GO Analysis |
2 proteins |
Classifier used Gene Ontology annotations. [FDR: 0.02] [SVM Score: 0.696412084458] |
SAP30
SDS3
|
| View GO Analysis |
2 proteins |
Classifier used Gene Ontology annotations. [FDR: 0.037] [SVM Score: 0.686699285993] |
RPD3
SDS3
|
| View GO Analysis |
2 proteins |
Classifier used Gene Ontology annotations. [FDR: 0.054] [SVM Score: 0.589562849057] |
HOS2
SDS3
|
| View GO Analysis |
2 proteins |
Classifier used Gene Ontology annotations. [FDR: 0.054] [SVM Score: 0.571021428511] |
HOS1
SDS3
|
| View GO Analysis |
2 proteins |
Classifier used Gene Ontology annotations. [FDR: 0.07] [SVM Score: 0.500334647638] |
SDS3
STB2
|
| View GO Analysis |
2 proteins |
Classifier used Gene Ontology annotations. [FDR: 0.084] [SVM Score: 0.477190248891] |
HDA1
SDS3
|