


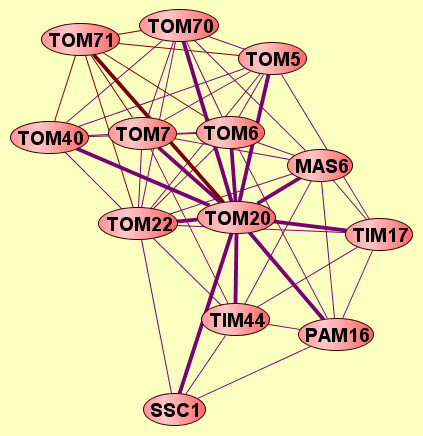
| Protein: | TOM20 |
| From Publication: | Qiu J, Noble WS (2008) Predicting Co-Complexed Protein Pairs from Heterogeneous Data. PLoS Comput Biol 4(4): e1000054. doi:10.1371/journal.pcbi.1000054 |
| Complexes containing TOM20: | 13 |
| LEGEND: |
|||
| = Same process, or one is unknown. | = Same branch, distance 4. | ||
| = Same branch, distance 1. | = Same branch, distance 5. | ||
| = Same branch, distance 2. | = Same branch, distance 6 or more. | ||
| = Same branch, distance 3. | = Not in same branch of GO. | ||
| Size | Notes | Members | |
| View GO Analysis | 2 proteins | Classfier did not use Gene Ontology annotations. [FDR: 0.021] [SVM Score: 0.77240946673] | TOM20 TOM7 |
| View GO Analysis | 2 proteins | Classifier used Gene Ontology annotations. [FDR: 0.02] [SVM Score: 1.4007129196] | TOM20 TOM6 |
| View GO Analysis | 2 proteins | Classifier used Gene Ontology annotations. [FDR: 0.02] [SVM Score: 1.3697010692] | TOM20 TOM22 |
| View GO Analysis | 2 proteins | Classifier used Gene Ontology annotations. [FDR: 0.02] [SVM Score: 1.31764346603] | TOM20 TOM40 |
| View GO Analysis | 2 proteins | Classifier used Gene Ontology annotations. [FDR: 0.02] [SVM Score: 1.23022556799] | TOM20 TOM7 |
| View GO Analysis | 2 proteins | Classifier used Gene Ontology annotations. [FDR: 0.02] [SVM Score: 0.937876951744] | TOM20 TOM70 |
| View GO Analysis | 2 proteins | Classifier used Gene Ontology annotations. [FDR: 0.069] [SVM Score: 0.852982767162] | TOM20 TOM5 |
| View GO Analysis | 2 proteins | Classifier used Gene Ontology annotations. [FDR: 0.07] [SVM Score: 0.811224640826] | TOM20 TOM71 |
| View GO Analysis | 2 proteins | Classifier used Gene Ontology annotations. [FDR: 0.069] [SVM Score: 0.62151990506] | TIM44 TOM20 |
| View GO Analysis | 2 proteins | Classifier used Gene Ontology annotations. [FDR: 0.069] [SVM Score: 0.60050802863] | TIM17 TOM20 |
| View GO Analysis | 2 proteins | Classifier used Gene Ontology annotations. [FDR: 0.069] [SVM Score: 0.567053089031] | TIM23 TOM20 |
| View GO Analysis | 2 proteins | Classifier used Gene Ontology annotations. [FDR: 0.069] [SVM Score: 0.541874977997] | PAM16 TOM20 |
| View GO Analysis | 2 proteins | Classifier used Gene Ontology annotations. [FDR: 0.099] [SVM Score: 0.462677938044] | SSC1 TOM20 |