


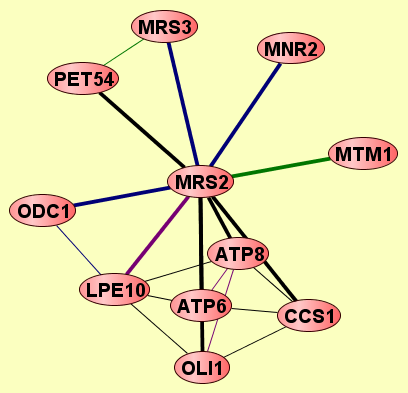
| Protein: | MRS2 |
| From Publication: | Qiu J, Noble WS (2008) Predicting Co-Complexed Protein Pairs from Heterogeneous Data. PLoS Comput Biol 4(4): e1000054. doi:10.1371/journal.pcbi.1000054 |
| Complexes containing MRS2: | 10 |
| LEGEND: |
|||
| = Same process, or one is unknown. | = Same branch, distance 4. | ||
| = Same branch, distance 1. | = Same branch, distance 5. | ||
| = Same branch, distance 2. | = Same branch, distance 6 or more. | ||
| = Same branch, distance 3. | = Not in same branch of GO. | ||
| Size | Notes | Members | |
| View GO Analysis | 2 proteins | Classifier used Gene Ontology annotations. [FDR: 0.02] [SVM Score: 1.24482981433] | LPE10 MRS2 |
| View GO Analysis | 2 proteins | Classifier used Gene Ontology annotations. [FDR: 0.02] [SVM Score: 0.93145257441] | ATP6 MRS2 |
| View GO Analysis | 2 proteins | Classifier used Gene Ontology annotations. [FDR: 0.07] [SVM Score: 0.811598153649] | MRS2 PET54 |
| View GO Analysis | 2 proteins | Classifier used Gene Ontology annotations. [FDR: 0.068] [SVM Score: 0.795041114485] | MRS2 MRS3 |
| View GO Analysis | 2 proteins | Classifier used Gene Ontology annotations. [FDR: 0.02] [SVM Score: 0.764478110228] | MRS2 OLI1 |
| View GO Analysis | 2 proteins | Classifier used Gene Ontology annotations. [FDR: 0.02] [SVM Score: 0.711280031115] | ATP8 MRS2 |
| View GO Analysis | 2 proteins | Classifier used Gene Ontology annotations. [FDR: 0.036] [SVM Score: 0.650113704652] | MRS2 MTM1 |
| View GO Analysis | 2 proteins | Classifier used Gene Ontology annotations. [FDR: 0.052] [SVM Score: 0.556659520082] | MRS2 ODC1 |
| View GO Analysis | 2 proteins | Classifier used Gene Ontology annotations. [FDR: 0.069] [SVM Score: 0.47494950265] | CCS1 MRS2 |
| View GO Analysis | 2 proteins | Classifier used Gene Ontology annotations. [FDR: 0.098] [SVM Score: 0.455808367438] | MNR2 MRS2 |