


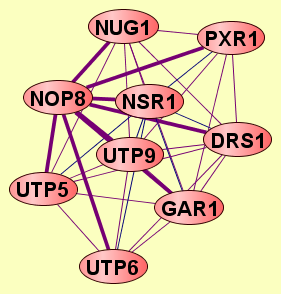
| Protein: | NOP8 |
| From Publication: | Qiu J, Noble WS (2008) Predicting Co-Complexed Protein Pairs from Heterogeneous Data. PLoS Comput Biol 4(4): e1000054. doi:10.1371/journal.pcbi.1000054 |
| Complexes containing NOP8: | 8 |
| LEGEND: |
|||
| = Same process, or one is unknown. | = Same branch, distance 4. | ||
| = Same branch, distance 1. | = Same branch, distance 5. | ||
| = Same branch, distance 2. | = Same branch, distance 6 or more. | ||
| = Same branch, distance 3. | = Not in same branch of GO. | ||
| Size | Notes | Members | |
| View GO Analysis | 2 proteins | Classfier did not use Gene Ontology annotations. [FDR: 0.021] [SVM Score: 0.655590836411] | NOP8 UTP9 |
| View GO Analysis | 2 proteins | Classfier did not use Gene Ontology annotations. [FDR: 0.091] [SVM Score: 0.492991820135] | NOP8 UTP5 |
| View GO Analysis | 2 proteins | Classfier did not use Gene Ontology annotations. [FDR: 0.039] [SVM Score: 0.467435791052] | NOP8 NSR1 |
| View GO Analysis | 2 proteins | Classfier did not use Gene Ontology annotations. [FDR: 0.021] [SVM Score: 0.459078493907] | NOP8 UTP6 |
| View GO Analysis | 2 proteins | Classfier did not use Gene Ontology annotations. [FDR: 0.04] [SVM Score: 0.434521506196] | NOP8 NUG1 |
| View GO Analysis | 2 proteins | Classfier did not use Gene Ontology annotations. [FDR: 0.021] [SVM Score: 0.42523386079] | NOP8 PXR1 |
| View GO Analysis | 2 proteins | Classfier did not use Gene Ontology annotations. [FDR: 0.057] [SVM Score: 0.386923691436] | GAR1 NOP8 |
| View GO Analysis | 2 proteins | Classifier used Gene Ontology annotations. [FDR: 0.069] [SVM Score: 0.594058282157] | DRS1 NOP8 |