| |
Size |
Notes |
Members |
| View GO Analysis |
2 proteins |
Classifier used Gene Ontology annotations. [FDR: 0.02] [SVM Score: 0.856020349662] |
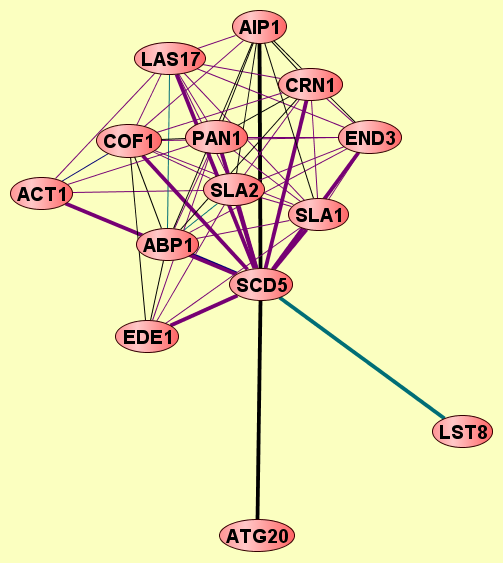
ABP1
SCD5
|
| View GO Analysis |
2 proteins |
Classifier used Gene Ontology annotations. [FDR: 0.02] [SVM Score: 0.818017178707] |
PAN1
SCD5
|
| View GO Analysis |
2 proteins |
Classifier used Gene Ontology annotations. [FDR: 0.02] [SVM Score: 0.705261232361] |
SCD5
SLA1
|
| View GO Analysis |
2 proteins |
Classifier used Gene Ontology annotations. [FDR: 0.038] [SVM Score: 0.637047075585] |
LST8
SCD5
|
| View GO Analysis |
2 proteins |
Classifier used Gene Ontology annotations. [FDR: 0.054] [SVM Score: 0.635272797085] |
ACT1
SCD5
|
| View GO Analysis |
2 proteins |
Classifier used Gene Ontology annotations. [FDR: 0.054] [SVM Score: 0.631194908711] |
ATG20
SCD5
|
| View GO Analysis |
2 proteins |
Classifier used Gene Ontology annotations. [FDR: 0.036] [SVM Score: 0.616279694716] |
LAS17
SCD5
|
| View GO Analysis |
2 proteins |
Classifier used Gene Ontology annotations. [FDR: 0.054] [SVM Score: 0.5639591166] |
AIP1
SCD5
|
| View GO Analysis |
2 proteins |
Classifier used Gene Ontology annotations. [FDR: 0.069] [SVM Score: 0.562678671573] |
SCD5
SLA2
|
| View GO Analysis |
2 proteins |
Classifier used Gene Ontology annotations. [FDR: 0.069] [SVM Score: 0.533495787629] |
CRN1
SCD5
|
| View GO Analysis |
2 proteins |
Classifier used Gene Ontology annotations. [FDR: 0.085] [SVM Score: 0.527335558343] |
COF1
SCD5
|
| View GO Analysis |
2 proteins |
Classifier used Gene Ontology annotations. [FDR: 0.069] [SVM Score: 0.495444735099] |
END3
SCD5
|
| View GO Analysis |
2 proteins |
Classifier used Gene Ontology annotations. [FDR: 0.069] [SVM Score: 0.471600463107] |
EDE1
SCD5
|