| |
Size |
Notes |
Members |
| View GO Analysis |
2 proteins |
Classfier did not use Gene Ontology annotations. [FDR: 0.021] [SVM Score: 0.916020812952] |
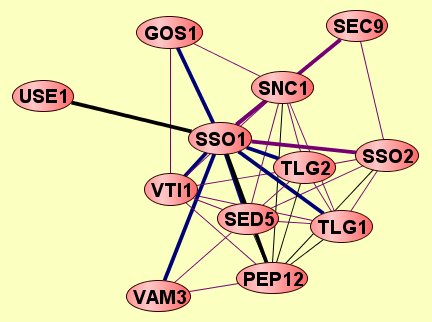
SED5
SSO1
|
| View GO Analysis |
2 proteins |
Classfier did not use Gene Ontology annotations. [FDR: 0.021] [SVM Score: 0.891074311778] |
PEP12
SSO1
|
| View GO Analysis |
2 proteins |
Classfier did not use Gene Ontology annotations. [FDR: 0.021] [SVM Score: 0.827285065402] |
SSO1
TLG1
|
| View GO Analysis |
2 proteins |
Classfier did not use Gene Ontology annotations. [FDR: 0.021] [SVM Score: 0.795636347244] |
SSO1
TLG2
|
| View GO Analysis |
2 proteins |
Classfier did not use Gene Ontology annotations. [FDR: 0.038] [SVM Score: 0.567693787645] |
SSO1
USE1
|
| View GO Analysis |
2 proteins |
Classifier used Gene Ontology annotations. [FDR: 0.02] [SVM Score: 1.49345630538] |
SNC1
SSO1
|
| View GO Analysis |
2 proteins |
Classifier used Gene Ontology annotations. [FDR: 0.02] [SVM Score: 1.2686880108] |
SSO1
SSO2
|
| View GO Analysis |
2 proteins |
Classifier used Gene Ontology annotations. [FDR: 0.02] [SVM Score: 1.20148573751] |
SEC9
SSO1
|
| View GO Analysis |
2 proteins |
Classifier used Gene Ontology annotations. [FDR: 0.02] [SVM Score: 0.889366664598] |
SED5
SSO1
|
| View GO Analysis |
2 proteins |
Classifier used Gene Ontology annotations. [FDR: 0.02] [SVM Score: 0.88299219887] |
PEP12
SSO1
|
| View GO Analysis |
2 proteins |
Classifier used Gene Ontology annotations. [FDR: 0.036] [SVM Score: 0.812972779074] |
SSO1
TLG1
|
| View GO Analysis |
2 proteins |
Classifier used Gene Ontology annotations. [FDR: 0.037] [SVM Score: 0.628048324875] |
SSO1
VTI1
|
| View GO Analysis |
2 proteins |
Classifier used Gene Ontology annotations. [FDR: 0.069] [SVM Score: 0.622055185702] |
GOS1
SSO1
|
| View GO Analysis |
2 proteins |
Classifier used Gene Ontology annotations. [FDR: 0.069] [SVM Score: 0.519256789554] |
SSO1
VAM3
|