


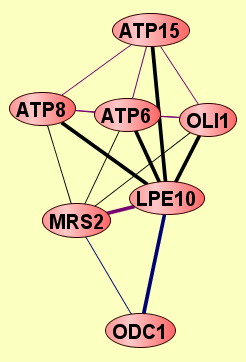
| Protein: | LPE10 |
| From Publication: | Qiu J, Noble WS (2008) Predicting Co-Complexed Protein Pairs from Heterogeneous Data. PLoS Comput Biol 4(4): e1000054. doi:10.1371/journal.pcbi.1000054 |
| Complexes containing LPE10: | 6 |
| LEGEND: |
|||
| = Same process, or one is unknown. | = Same branch, distance 4. | ||
| = Same branch, distance 1. | = Same branch, distance 5. | ||
| = Same branch, distance 2. | = Same branch, distance 6 or more. | ||
| = Same branch, distance 3. | = Not in same branch of GO. | ||
| Size | Notes | Members | |
| View GO Analysis | 2 proteins | Classifier used Gene Ontology annotations. [FDR: 0.02] [SVM Score: 1.24482981433] | LPE10 MRS2 |
| View GO Analysis | 2 proteins | Classifier used Gene Ontology annotations. [FDR: 0.02] [SVM Score: 1.23732535214] | ATP6 LPE10 |
| View GO Analysis | 2 proteins | Classifier used Gene Ontology annotations. [FDR: 0.02] [SVM Score: 1.15158246853] | ATP8 LPE10 |
| View GO Analysis | 2 proteins | Classifier used Gene Ontology annotations. [FDR: 0.02] [SVM Score: 1.14441925045] | LPE10 OLI1 |
| View GO Analysis | 2 proteins | Classifier used Gene Ontology annotations. [FDR: 0.02] [SVM Score: 0.680639918067] | LPE10 ODC1 |
| View GO Analysis | 2 proteins | Classifier used Gene Ontology annotations. [FDR: 0.054] [SVM Score: 0.634473549103] | ATP15 LPE10 |