| |
Size |
Notes |
Members |
| View GO Analysis |
2 proteins |
Classifier used Gene Ontology annotations. [FDR: 0.02] [SVM Score: 1.16411538311] |
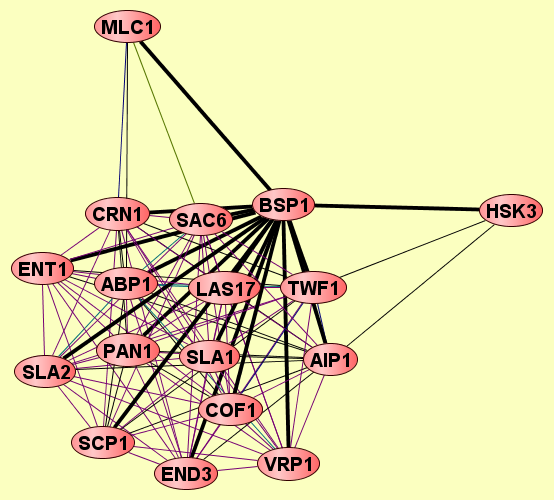
BSP1
PAN1
|
| View GO Analysis |
2 proteins |
Classifier used Gene Ontology annotations. [FDR: 0.02] [SVM Score: 1.14412393129] |
BSP1
SLA1
|
| View GO Analysis |
2 proteins |
Classifier used Gene Ontology annotations. [FDR: 0.02] [SVM Score: 1.04200086416] |
BSP1
CRN1
|
| View GO Analysis |
2 proteins |
Classifier used Gene Ontology annotations. [FDR: 0.02] [SVM Score: 0.815647397513] |
AIP1
BSP1
|
| View GO Analysis |
2 proteins |
Classifier used Gene Ontology annotations. [FDR: 0.02] [SVM Score: 0.788148418627] |
BSP1
SLA2
|
| View GO Analysis |
2 proteins |
Classifier used Gene Ontology annotations. [FDR: 0.038] [SVM Score: 0.717608784974] |
BSP1
ENT1
|
| View GO Analysis |
2 proteins |
Classifier used Gene Ontology annotations. [FDR: 0.038] [SVM Score: 0.69920578598] |
ABP1
BSP1
|
| View GO Analysis |
2 proteins |
Classifier used Gene Ontology annotations. [FDR: 0.069] [SVM Score: 0.611975235566] |
BSP1
SAC6
|
| View GO Analysis |
2 proteins |
Classifier used Gene Ontology annotations. [FDR: 0.069] [SVM Score: 0.547045326342] |
BSP1
END3
|
| View GO Analysis |
2 proteins |
Classifier used Gene Ontology annotations. [FDR: 0.084] [SVM Score: 0.540271902668] |
BSP1
MLC1
|
| View GO Analysis |
2 proteins |
Classifier used Gene Ontology annotations. [FDR: 0.069] [SVM Score: 0.532204102819] |
BSP1
COF1
|
| View GO Analysis |
2 proteins |
Classifier used Gene Ontology annotations. [FDR: 0.084] [SVM Score: 0.524108541856] |
BSP1
SCP1
|
| View GO Analysis |
2 proteins |
Classifier used Gene Ontology annotations. [FDR: 0.084] [SVM Score: 0.507772669797] |
BSP1
HSK3
|
| View GO Analysis |
2 proteins |
Classifier used Gene Ontology annotations. [FDR: 0.084] [SVM Score: 0.497760809662] |
BSP1
VRP1
|
| View GO Analysis |
2 proteins |
Classifier used Gene Ontology annotations. [FDR: 0.084] [SVM Score: 0.490346429348] |
BSP1
LAS17
|
| View GO Analysis |
2 proteins |
Classifier used Gene Ontology annotations. [FDR: 0.084] [SVM Score: 0.485059608055] |
BSP1
TWF1
|