


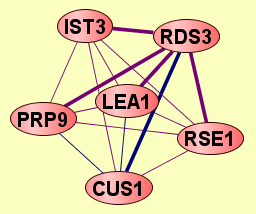
| Protein: | RDS3 |
| From Publication: | Qiu J, Noble WS (2008) Predicting Co-Complexed Protein Pairs from Heterogeneous Data. PLoS Comput Biol 4(4): e1000054. doi:10.1371/journal.pcbi.1000054 |
| Complexes containing RDS3: | 5 |
| LEGEND: |
|||
| = Same process, or one is unknown. | = Same branch, distance 4. | ||
| = Same branch, distance 1. | = Same branch, distance 5. | ||
| = Same branch, distance 2. | = Same branch, distance 6 or more. | ||
| = Same branch, distance 3. | = Not in same branch of GO. | ||
| Size | Notes | Members | |
| View GO Analysis | 2 proteins | Classifier used Gene Ontology annotations. [FDR: 0.038] [SVM Score: 0.668670447989] | CUS1 RDS3 |
| View GO Analysis | 2 proteins | Classifier used Gene Ontology annotations. [FDR: 0.054] [SVM Score: 0.568516972738] | LEA1 RDS3 |
| View GO Analysis | 2 proteins | Classifier used Gene Ontology annotations. [FDR: 0.084] [SVM Score: 0.477698001499] | PRP9 RDS3 |
| View GO Analysis | 2 proteins | Classifier used Gene Ontology annotations. [FDR: 0.099] [SVM Score: 0.459625136127] | RDS3 RSE1 |
| View GO Analysis | 2 proteins | Classifier used Gene Ontology annotations. [FDR: 0.085] [SVM Score: 0.454917278241] | IST3 RDS3 |