


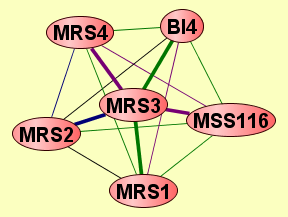
| Protein: | MRS3 |
| From Publication: | Qiu J, Noble WS (2008) Predicting Co-Complexed Protein Pairs from Heterogeneous Data. PLoS Comput Biol 4(4): e1000054. doi:10.1371/journal.pcbi.1000054 |
| Complexes containing MRS3: | 6 |
| LEGEND: |
|||
| = Same process, or one is unknown. | = Same branch, distance 4. | ||
| = Same branch, distance 1. | = Same branch, distance 5. | ||
| = Same branch, distance 2. | = Same branch, distance 6 or more. | ||
| = Same branch, distance 3. | = Not in same branch of GO. | ||
| Size | Notes | Members | |
| View GO Analysis | 2 proteins | Classfier did not use Gene Ontology annotations. [FDR: 0.073] [SVM Score: 0.7718002058] | MRS1 MRS3 |
| View GO Analysis | 2 proteins | Classifier used Gene Ontology annotations. [FDR: 0.038] [SVM Score: 0.892317768713] | MRS3 MRS4 |
| View GO Analysis | 2 proteins | Classifier used Gene Ontology annotations. [FDR: 0.085] [SVM Score: 0.809671369719] | BI4 MRS3 |
| View GO Analysis | 2 proteins | Classifier used Gene Ontology annotations. [FDR: 0.068] [SVM Score: 0.795041114485] | MRS2 MRS3 |
| View GO Analysis | 2 proteins | Classifier used Gene Ontology annotations. [FDR: 0.068] [SVM Score: 0.79490431379] | MRS1 MRS3 |
| View GO Analysis | 2 proteins | Classifier used Gene Ontology annotations. [FDR: 0.098] [SVM Score: 0.789502752287] | MRS3 MSS116 |