


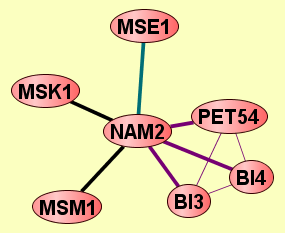
| Protein: | NAM2 |
| From Publication: | Qiu J, Noble WS (2008) Predicting Co-Complexed Protein Pairs from Heterogeneous Data. PLoS Comput Biol 4(4): e1000054. doi:10.1371/journal.pcbi.1000054 |
| Complexes containing NAM2: | 6 |
| LEGEND: |
|||
| = Same process, or one is unknown. | = Same branch, distance 4. | ||
| = Same branch, distance 1. | = Same branch, distance 5. | ||
| = Same branch, distance 2. | = Same branch, distance 6 or more. | ||
| = Same branch, distance 3. | = Not in same branch of GO. | ||
| Size | Notes | Members | |
| View GO Analysis | 2 proteins | Classifier used Gene Ontology annotations. [FDR: 0.02] [SVM Score: 0.901032894] | BI4 NAM2 |
| View GO Analysis | 2 proteins | Classifier used Gene Ontology annotations. [FDR: 0.07] [SVM Score: 0.811777588563] | NAM2 PET54 |
| View GO Analysis | 2 proteins | Classifier used Gene Ontology annotations. [FDR: 0.037] [SVM Score: 0.644435544619] | BI3 NAM2 |
| View GO Analysis | 2 proteins | Classifier used Gene Ontology annotations. [FDR: 0.038] [SVM Score: 0.636257485089] | MSE1 NAM2 |
| View GO Analysis | 2 proteins | Classifier used Gene Ontology annotations. [FDR: 0.084] [SVM Score: 0.490470010669] | MSM1 NAM2 |
| View GO Analysis | 2 proteins | Classifier used Gene Ontology annotations. [FDR: 0.084] [SVM Score: 0.488057324845] | MSK1 NAM2 |