


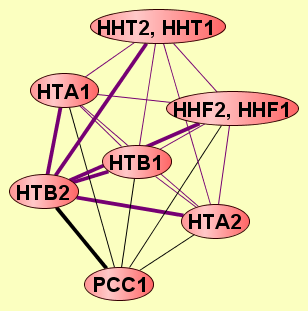
| Protein: | HTB2 |
| From Publication: | Qiu J, Noble WS (2008) Predicting Co-Complexed Protein Pairs from Heterogeneous Data. PLoS Comput Biol 4(4): e1000054. doi:10.1371/journal.pcbi.1000054 |
| Complexes containing HTB2: | 13 |
| LEGEND: |
|||
| = Same process, or one is unknown. | = Same branch, distance 4. | ||
| = Same branch, distance 1. | = Same branch, distance 5. | ||
| = Same branch, distance 2. | = Same branch, distance 6 or more. | ||
| = Same branch, distance 3. | = Not in same branch of GO. | ||
| Size | Notes | Members | |
| View GO Analysis | 2 proteins | Classfier did not use Gene Ontology annotations. [FDR: 0.021] [SVM Score: 0.969895385951] | HHF1, HHF2 HTB2 |
| View GO Analysis | 2 proteins | Classfier did not use Gene Ontology annotations. [FDR: 0.021] [SVM Score: 0.953931048554] | HTA1 HTB2 |
| View GO Analysis | 2 proteins | Classfier did not use Gene Ontology annotations. [FDR: 0.021] [SVM Score: 0.876757369338] | HHF1, HHF2 HTB2 |
| View GO Analysis | 2 proteins | Classfier did not use Gene Ontology annotations. [FDR: 0.021] [SVM Score: 0.875083637607] | HTA2 HTB2 |
| View GO Analysis | 2 proteins | Classfier did not use Gene Ontology annotations. [FDR: 0.021] [SVM Score: 0.815247847361] | HHT1, HHT2 HTB2 |
| View GO Analysis | 2 proteins | Classifier used Gene Ontology annotations. [FDR: 0.02] [SVM Score: 0.998472118815] | HTA1 HTB2 |
| View GO Analysis | 2 proteins | Classifier used Gene Ontology annotations. [FDR: 0.02] [SVM Score: 0.989672544357] | HHF1, HHF2 HTB2 |
| View GO Analysis | 2 proteins | Classifier used Gene Ontology annotations. [FDR: 0.02] [SVM Score: 0.943063794646] | HHF1, HHF2 HTB2 |
| View GO Analysis | 2 proteins | Classifier used Gene Ontology annotations. [FDR: 0.02] [SVM Score: 0.92737707599] | HHT1, HHT2 HTB2 |
| View GO Analysis | 2 proteins | Classifier used Gene Ontology annotations. [FDR: 0.02] [SVM Score: 0.88028045778] | HTA2 HTB2 |
| View GO Analysis | 2 proteins | Classifier used Gene Ontology annotations. [FDR: 0.02] [SVM Score: 0.874941527085] | HHT1, HHT2 HTB2 |
| View GO Analysis | 2 proteins | Classifier used Gene Ontology annotations. [FDR: 0.037] [SVM Score: 0.839440244008] | HTB1 HTB2 |
| View GO Analysis | 2 proteins | Classifier used Gene Ontology annotations. [FDR: 0.038] [SVM Score: 0.623361437107] | HTB2 PCC1 |